Too many considerations per decision
📊 Most dashboards track 30-50 metrics. Most decisions get made from three of them. The gap is where real capacity is going to waste, and more!

Hello! You've arrived at What Actually Works 🤓
We break down the real strategies, decisions, and plays that actually move the needle in your marketing, and here it for today.
📊 Your dashboard tracks 40 metrics. Your team decides things with three.
Most marketing dashboards now track somewhere between 30 and 50 metrics. Most marketing decisions get made by looking at three of them.
That gap, between what gets displayed and what actually drives a call, is the real cost of trying to measure everything: not that it’s technically impossible, but that it produces a dashboard nobody can act on, maintained by a team that could have spent that measurement capacity somewhere it would have mattered.
The instinct to add another metric feels safe and low-cost in the moment, one more column, one more chart, more visibility can’t hurt.
It’s not actually free. Every metric added competes for the same limited attention, and the same limited capacity to build, maintain, and actually interpret it, and a dashboard that tries to cover everything ends up being the tool nobody opens because no single view answers a real question fast enough to be useful.
Run every current metric through a simple test before deciding what survives
A metric earns its place on a dashboard only if there’s a specific action that changes depending on what it shows. If the honest answer to “what would we do differently based on this number” is vague, that metric is decoration, not decision support.
Pull your current dashboard and apply that test to every metric on it. Anything that fails, no specific action tied to a specific reading, moves to a secondary view or gets cut outright rather than continuing to occupy space in the primary report.
Cut to what a leadership team can actually act on in one sitting
A dashboard with 40 metrics doesn’t get read in full. It gets skimmed, and whatever’s skimmed rarely drives the decision the full data actually supports.
Bring the top-line view down to five to ten metrics that genuinely trigger action, with everything else available on request rather than displayed by default.
A leadership team that can absorb the whole primary view in one sitting makes faster, more consistent calls than one scrolling past thirty rows to find the three that matter.
Redirect the freed measurement capacity toward the metric you’re currently missing
Cutting metrics isn’t just about clarity. It’s about freeing the actual time and tooling capacity that was going into maintaining metrics nobody acted on, capacity that could instead build out proper measurement for something currently tracked poorly or not at all.
This exact gap, between what teams are betting on and what they actually trust their own numbers to prove, showed up in AirOps’ survey of 300+ CMOs and VPs: 86.6% are prioritizing AI search right now, but only 23% say they trust their measurement of it.
That’s the same mismatch driving the dashboard problem, capacity going toward a channel before the capacity to actually read it exists.
The full report breaks down where leaders are reallocating budget and closing capability gaps while targets climb faster than the budget to support them. You can download the report here.
A metric that never changes a decision isn’t neutral. It’s actively costing the attention and capacity a metric that would have mattered never got.
Partnership with Zenty
You don't have a catalog problem. You have a coverage problem.
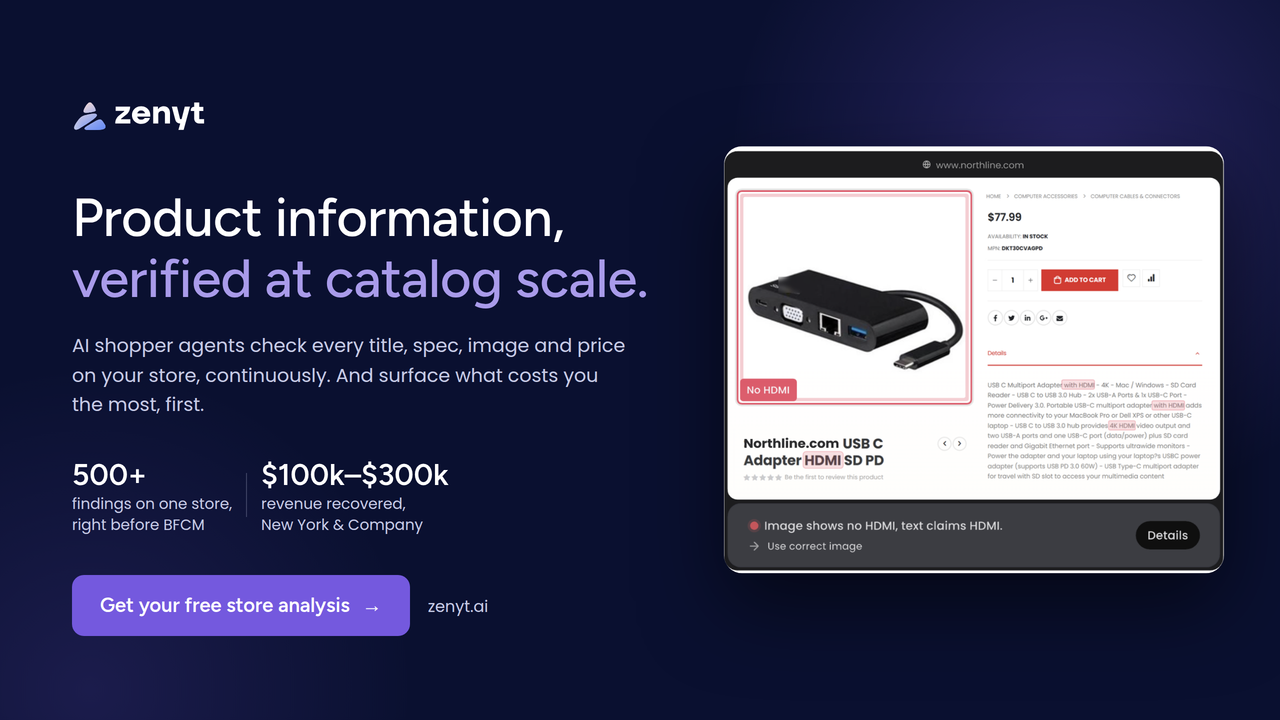
Right now, somewhere on your store, a photo shows pockets while the description says none.
A midi dress is labeled full length. A price reads one thing on the page and another in the cart. Across thousands of SKUs and variants, no team can browse every page before customers do.
Zenyt's AI shopper agents review your entire store the way a customer would, checking every title, spec, image, and price against your source of truth, continuously. Then they rank what is costing you the most first.
- New York & Company identified 500+ findings before BFCM and uncovered $100K–$300K in potential revenue.
- Caudalie generated €700K in incremental revenue within 12 weeks.
- LG protected $900K in EBITDA and saved 2,100 working hours.
Your catalog changes every day between now and Black Friday. Get your free store analysis before peak traffic finds the gaps first.
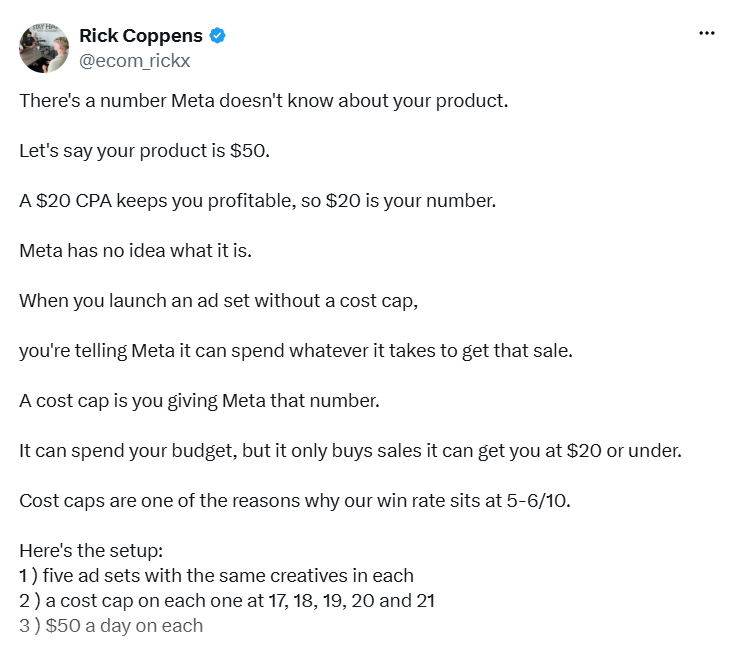
🐥 Tweet Worth Saving
Thanks for being part of the WAW team 💃 We’d love to know if this was helpful so we can continue playing it smart with the right strategies.