You’re throwing away your rank
🥲You're publishing all your visuals at once. You're throwing away two ranking events, and more!

Hello! You've arrived at What Actually Works 🤓
We break down the real strategies, decisions, and plays that actually move the needle in your marketing, and here it for today.
🥲You’re throwing away your rank
Publishing everything at launch collapses three separate ranking signal opportunities into one. Each visual addition is a discrete performance event. Treat it like one.
The Three-Stage Sequence
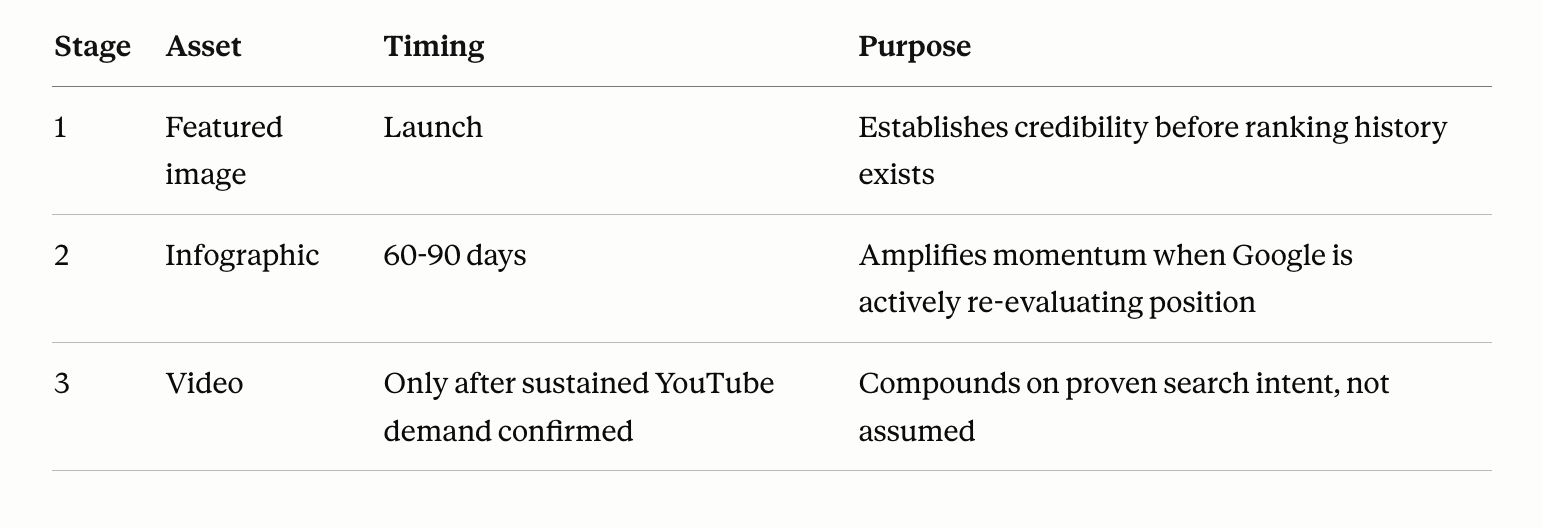
Build this roadmap for every high-performing evergreen page. Your production schedule becomes a compounding traffic calendar, not a one-time launch checklist.
The Highest-Leverage Timing Window Most Teams Miss
A page sitting positions six to fifteen that has held its position for at least 60 days is your immediate infographic target.
It has already proved it belongs in the conversation. Google has ranked it consistently. It just has not broken the top five yet. An infographic addition at this exact moment generates an engagement signal precisely when Google is evaluating whether the page deserves a higher position.
Pull Search Console monthly. Flag every page holding positions six to fifteen for two consecutive months without movement. That list is your infographic production queue.
Track whether additions move both ranking position and AI citation rates in the weeks following. SEMrush's AI Visibility Toolkit shows citation movement across ChatGPT and Google AI Mode alongside traditional ranking shifts so you can confirm the visual addition is compounding across both surfaces. You can try it for free for 7 days.
Annotate Every Addition As A Discrete Event
Sequential layering only produces compounding insight if each addition is tracked independently.
Without dated annotations, traffic lift from the infographic blends into overall page performance and gets attributed to nothing. With them, you build a visual ROI dataset that tells you exactly which asset produced which lift on which content type.
Three annotations. Three dated events. One conversation-ending answer the next time someone questions whether infographics are worth the budget.
The sequence is the strategy. The timing is the lever. Most teams are leaving both on the table.
Partnership with AirOps
Your buyers moved to AI search. Your content didn't follow.
52% of adults now research on ChatGPT, Gemini, and Perplexity. Those visitors convert at 4.4x the rate of organic search, and 83% of the citations they see go to pages updated in the last 12 months.
You're not losing to better content. You're losing to better structure, fresher pages, and off-site signals you haven't touched yet.
AirOps analyzed 15M+ AI queries and built the playbook content teams are using to close that gap right now. Inside you’ll find:
- Structural patterns that make your content easy for AI engines to extract and cite
- Refresh cadences and off-site signals that keep you visible as algorithms shift
- Team models and a 90-day action plan you can run this Quarter.
Teams at Carta, Ramp, Webflow, and Klaviyo are already running this playbook to win AI search visibility and pipeline.
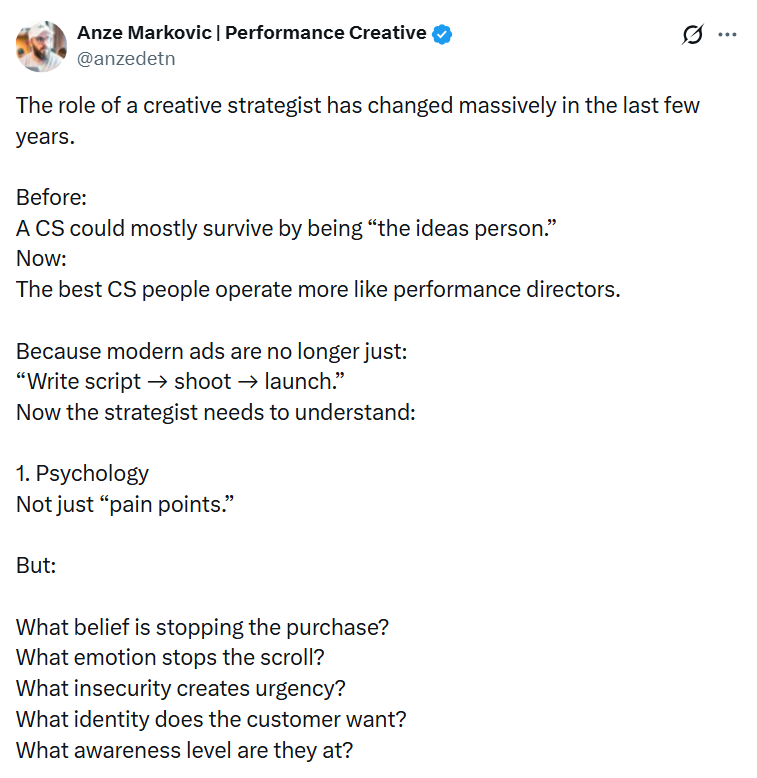
🐥 Tweet Worth Saving
Thanks for being part of the WAW team 💃 We’d love to know if this was helpful so we can continue playing it smart with the right strategies.