Your Best Ad Could Be Average
🧑💻 Before you spend more on that winner, check the benchmarks from 80,069 Meta video ads.

Howdy reader 👋
“This is our best ad. Put more budget behind it.”
Fair enough. But what if your best ad is still below average for your category?
You brief five more versions, approve another batch, and increase spend. A weak opener gets copied into every new video because nobody checked whether it was actually competitive.
That’s an expensive way to find out what needed fixing.
Billo’s free Q4 Performance Calculator helps you spot those gaps before they shape your next creative batch.
Built on 80,069 sales-objective Meta video ads across 14 categories from Q4 2025, it gives you a relevant comparison before you commit more budget.
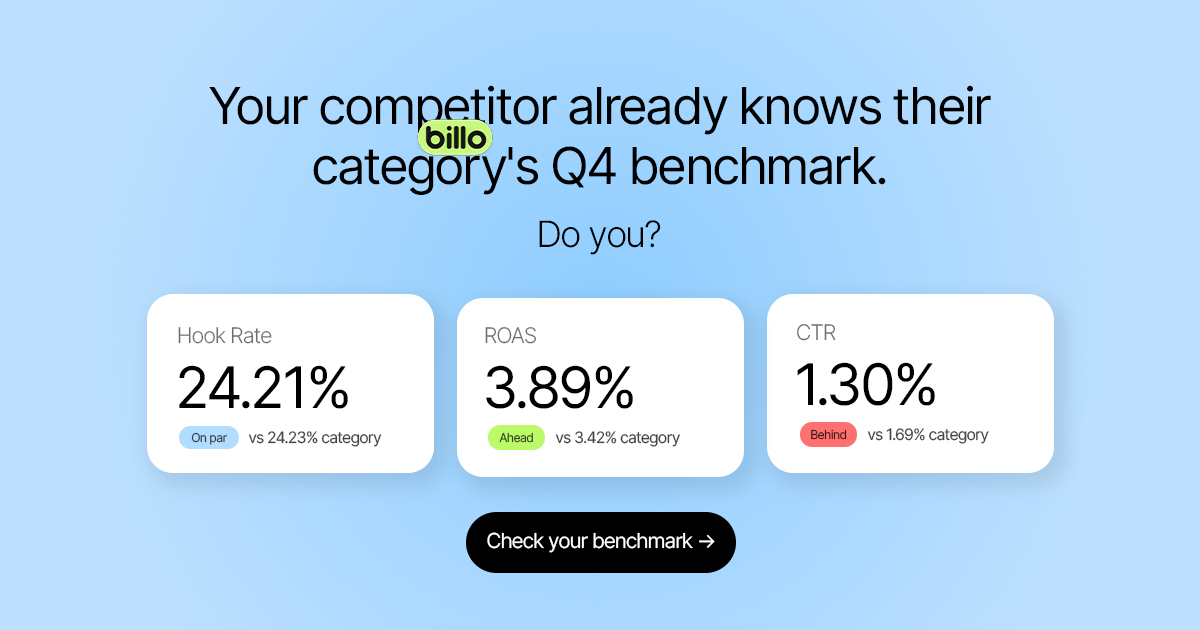
🎯 Step 1: Find your category’s opportunity. Choose your industry to see its Q4 benchmarks and peak month.
📊 Step 2: Find the gap worth testing. Enter last year’s Q4 hook rate, CTR, and ROAS. Instantly see where you’re ahead, behind, or matching your category.
🎬 Step 3: Give your team a specific direction. Get recommended fixes, category video examples, and a personalized creative calendar to guide your next batch.
The difference can change where you put your next dollar. Apparel averaged 4.11 ROAS, compared with 1.68 for Toys & Games.
But Toys & Games climbed roughly 115% from August to December. Judge it by the six-month average alone, and you could underestimate its strongest window.
Billo’s calculator puts your numbers in that context in under a minute, without changing anything in your campaigns.
Before you approve your next Q4 budget increase, check what a strong result actually looks like for your category.
A target worth chasing in September could sell December short.