Averages are hiding problems
📊Your average account health score can hide the problem costing you revenue, and more!

Hello! You've arrived at What Actually Works 🤓
We break down the real strategies, decisions, and plays that actually move the needle in your marketing, and here it for today.
📊Averages are hiding problems
Campaign cadence, automation coverage, and catalog completeness are often scored separately and then rolled into a single average. The issue is that these systems don’t operate independently. They influence each other, and the revenue loss usually comes from how they interact, not from any single low score.
Check 1: Automations powered by incomplete product data
Browse abandonment, abandoned cart, cross-sell, and product recommendation flows rely entirely on product data.
Missing images, incomplete descriptions, weak category tags, outdated inventory, or products without reviews don’t simply reduce conversions. They create empty recommendation blocks, broken product cards, or poor suggestions inside high-intent customer journeys.
Audit the exact SKUs feeding into each automation rather than relying on an overall catalog score. A healthy catalog can still contain high-traffic products with incomplete data.
Check 2: Campaign cadence supported by manual work
Two brands can send the same number of campaigns every week.
One relies on automated welcome, replenishment, post-purchase, and win-back flows. The other reaches the same cadence because someone rebuilds similar campaigns manually every week.
The send frequency looks identical, but the operational cost is completely different. If campaigns stop when the marketing team gets busy, automation coverage isn’t as strong as the score suggests.
Check 3: Product launches exposing hidden weaknesses
New launches receive the closest promotional attention while typically having the least complete product information.
Missing attributes, unfinished merchandising, inaccurate inventory, or weak recommendations become visible exactly when traffic peaks. The launch doesn’t create the problem. It reveals it.
The valuable insight isn’t the average score. It’s identifying combinations like strong automation running on weak product data, healthy campaign cadence replacing missing automations, or aggressive promotions driving traffic to incomplete product pages.
Omnisend now connects with Claude and ChatGPT through MCP, allowing brands to analyze campaigns, automations, product data, and account structure with a single prompt instead of manually comparing reports. Recent updates also added expanded automation management and on-brand email creation directly inside the platform.
Brands using Omnisend generate an average of $79 for every $1 spent, migrations are completed for free within five days, and pricing can be up to 35% lower than Klaviyo. You can get started with ready-made prompts here.
Use the ready-made prompt to uncover the interaction your average score isn’t showing.
Partnership with Billo
Most hooks fail in 2 seconds. These 3 types don't.
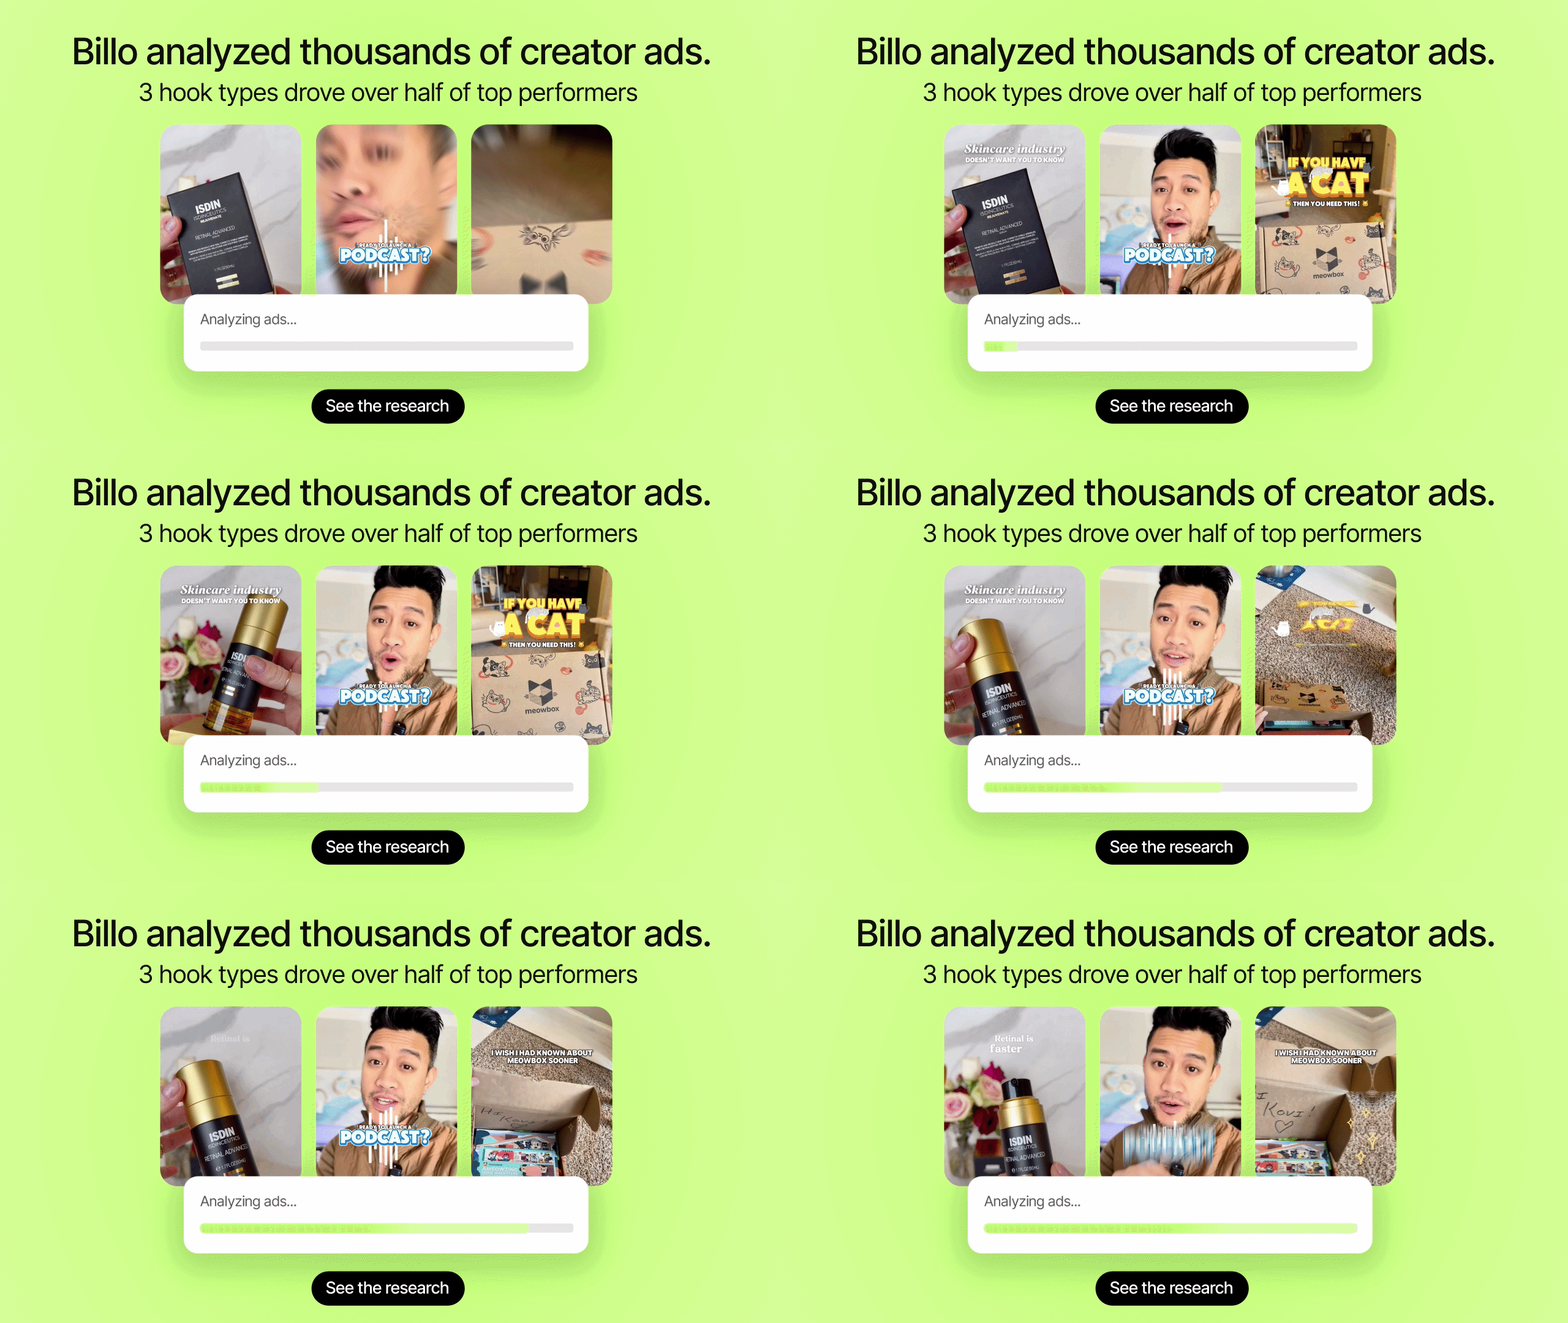
Billo pulled 6 months of creator ad data and tagged every top performer by hook type. Most of what's in your current brief barely showed up.
- Authentic Moment hooks made up over a quarter of top performers alone, and most had no script at all
- Audience Call-out hooks skipped the product completely in line one. Just named the viewer. "Husbands." "Hockey mom."
- List hooks, FOMO countdowns, and "forget X, try Y" setups were almost nowhere in the top tier
If your brief leans on that last one, you're fighting for attention exactly where people tune out fastest.
The breakdown has every hook type plus the actual lines that made the top tier, so you can steal the structure instead of guessing at it.
Read it before your next round of creator ads.
🐥 Tweet Worth Saving
Thanks for being part of the WAW team 💃 We’d love to know if this was helpful so we can continue playing it smart with the right strategies.