The Lie PMax is feeding you
👀PMax shows 8x ROAS. The agency calls it proof. The deck calls it scaling-ready. What's actually inside that number, and more!

Hello! You've arrived at What Actually Works 🤓
We break down the real strategies, decisions, and plays that actually move the needle in your marketing, and here it for today.
👀 The PMax ROAS That Lies To Your Face
PMax shows 8x ROAS. The agency calls it proof. The deck calls it scaling-ready. What's actually inside that number:
- Brand searches
- Returning customers
- Abandoned cart finishers
- People who typed your domain directly
PMax intercepted them, served an ad, and billed you for the conversion.
The math nobody walks you through: if 10% of your spend goes to brand at a 20x ROAS and the other 90% goes to everything else at a 0.5x ROAS, your blend looks like 2.45x. The blended number looks healthy. You're incinerating 90% of the budget.
The ROAS isn't wrong. It's measuring the wrong thing.
1. Add brand exclusions before you scale, not after
The fix is mechanical:
- Settings → Additional settings → Brand exclusions
- Create a Brand List with brand terms, product lines, common misspellings
- Apply to every non-brand PMax campaign
- Run a separate brand-only Search campaign to capture branded queries cleanly
The in-platform ROAS will drop. That's the point. Excluding brand keywords from PMax has been shown to reduce CAC between 19% and 60% while improving new customer acquisition. You're now seeing what prospecting spend is actually doing.
2. Run a holdout test before you trust the number
Geo-based incrementality is the cleanest read:
- Pause PMax in two matched markets for 14 days
- Leave it running in two others
- Compare total revenue across all four
If revenue stays flat in the paused markets, you weren't acquiring customers. You were paying Google for ones who were already coming.
Most agencies won't propose this test. The result usually argues against their retainer.
3. Force a brand-vs-non-brand split into weekly reporting
Four columns. Every dashboard:
- Branded revenue
- Non-branded revenue
- True new-customer acquisition
- Blended
If your PMax shows 10x ROAS but 60% comes from branded searches, you're about to pour budget into the wrong channel. The budget conversation changes overnight once the split is visible.
The PMax ROAS isn't proof. It's a mirror reflecting demand you already had. The brands worth scaling are the ones that can grow without that mirror.
Partnership with PrettyDamnQuick
Your checkout is leaking. Your analytics just won't tell you where.
You can see your CVR. You can see your AOV. What you can't see is exactly which part of your checkout is quietly killing both.
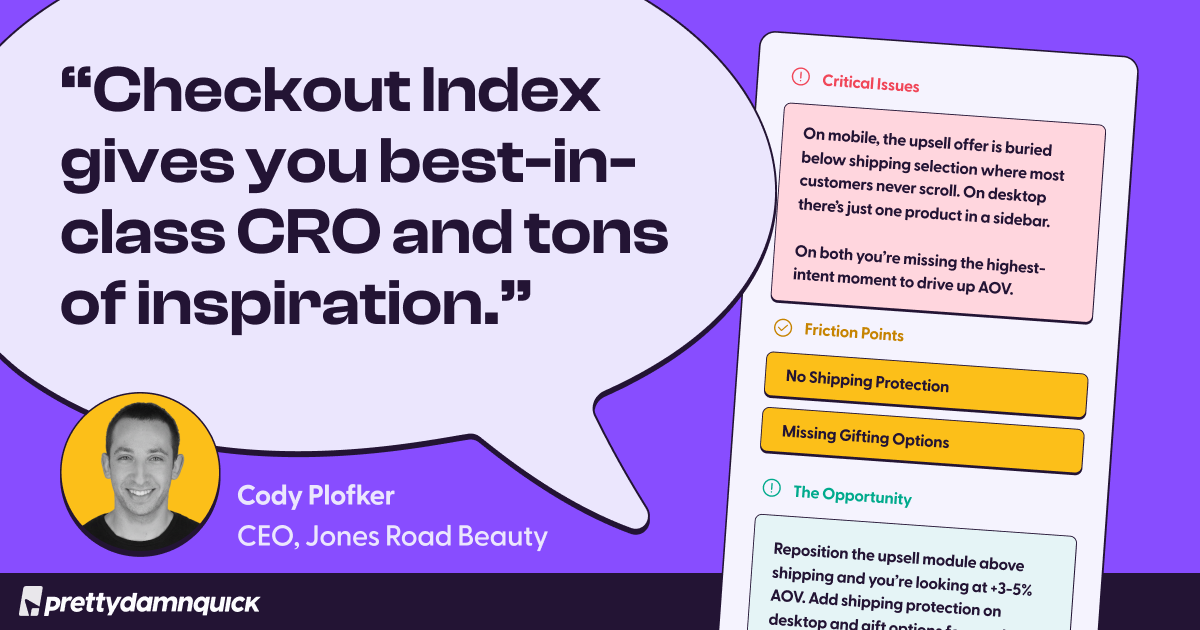
Checkout Index by PDQ fixes that in 60 seconds.
It scans 47+ checkout signals across your Shopify store, benchmarks you against 130M+ sessions across 500+ brands, and hands you a personalized health score with a projected revenue recovery figure.
No install. No demo call. No credit card. Enter your URL, and you're done.
Jones Road Beauty ran their store through it, expecting nothing. One critical issue surfaced immediately. Upsell was buried below shipping on mobile, where most customers never scroll, missing shipping protection and gifting options.
One fix and a projected 3-5% AOV lift from a single placement change
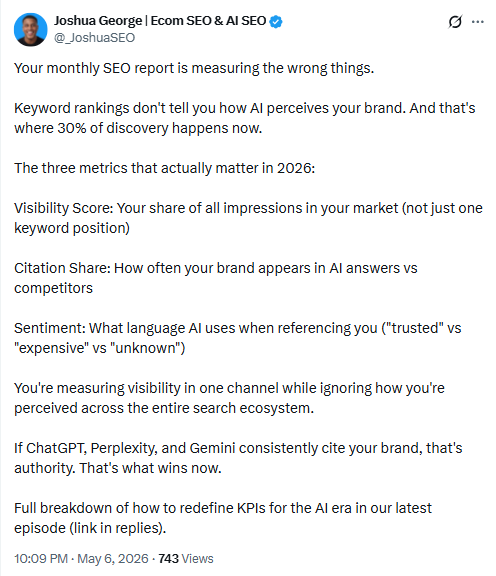
🐥 Tweet Worth Saving
Thanks for being part of the WAW team 💃 We’d love to know if this was helpful so we can continue playing it smart with the right strategies.